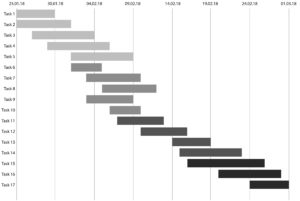
Gantt Chart

A graphical representation of when individual project tasks will be started and completed. Tasks are listed on the vertical axis and time (days, weeks, or months) is depicted on the horizontal axis. Bars are used to denote the expected start and completion time for each task. Other figures and labels may be added to the Gantt chart to designate special events or prerequisite tasks.
