
Goodman Diagram
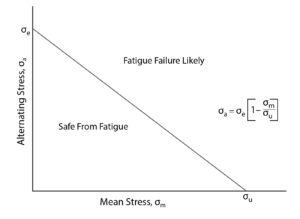
A graph of linear mean stress versus linear alternating stress that theoretically represents when the material will fail after some given number of load cycles. In practice, a Goodman diagram is based on the straight-line approximation of experimental data. The general trend given by the Goodman relation is one of decreasing fatigue life with increasing mean stress for a given level of alternating stress. By visual inspection of the diagram, it can be concluded that if the design point defined by the mean stress and the alternating stress lies under the Goodman line, then the part will likely survive; but, if the point defined by the operating conditions falls above the curve, then the part will likely fail.