Spectral Map
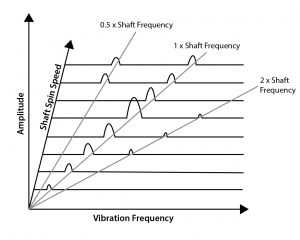
 A plot composed of multiple vibration, pressure pulsation, or stress amplitude spectra versus another variable, usually time or revolutions per minute.
Also known as a Waterfall Plot.
 A plot composed of multiple vibration, pressure pulsation, or stress amplitude spectra versus another variable, usually time or revolutions per minute.
Also known as a Waterfall Plot.